AirDNA, Airbtics, KeyData, Mashvisor, Rabbu and Rankbreeze compared: 2026 prices, data sources and the best Airbnb market research tool for each job.
Updated October 2026. Written and reviewed by the STR Market Superhost team. Prices checked against each vendor's pricing page on October 23, 2026.
Buying the wrong Airbnb is the most expensive mistake a host can make. Market research tools estimate what a property will earn before you buy, and show how your existing listings stack up against the competition.
We compared six tools hosts and investors use most: AirDNA, Airbtics, KeyData, Mashvisor, Rabbu's free calculator and Rankbreeze. Here is what each one costs, where its data comes from and which job it does best.
| Tool | Starting price | Data source | Best for | Rating (reviews) |
|---|---|---|---|---|
| AirDNA | Free tier; Research $34/month billed yearly ($400/year) or $125 month to month | Public listing and calendar data | Comparing markets and properties | 4.6 (943, Trustpilot) |
| Airbtics | Free plan; Pro $39/month or $109 billed yearly | Public listing and calendar data | Budget market research worldwide | 4.3 (126, Trustpilot) |
| KeyData | Custom quote | Reservation data shared by property managers | Managers benchmarking real bookings | Not yet rated |
| Mashvisor | From $49.99/month (Lite, billed yearly) | Rental and listing data for US addresses | Investors running deal math | 4.0 (482, Trustpilot) |
| Rabbu calculator | Free | Live Airbnb data, updated weekly | A fast first estimate | Not yet rated |
| Rankbreeze | From $29/month for up to 3 listings (about $9.67 each) | Airbnb search rankings | Hosts improving an existing listing | Not yet rated |
We compared each tool on data source and coverage, how easy it is to pull comparable listings, whether it shows seasonality and revenue percentiles, how well it fits buying versus running a listing, and price. We weighted real user ratings over marketing claims, and rankings are never paid. Read how we rank.

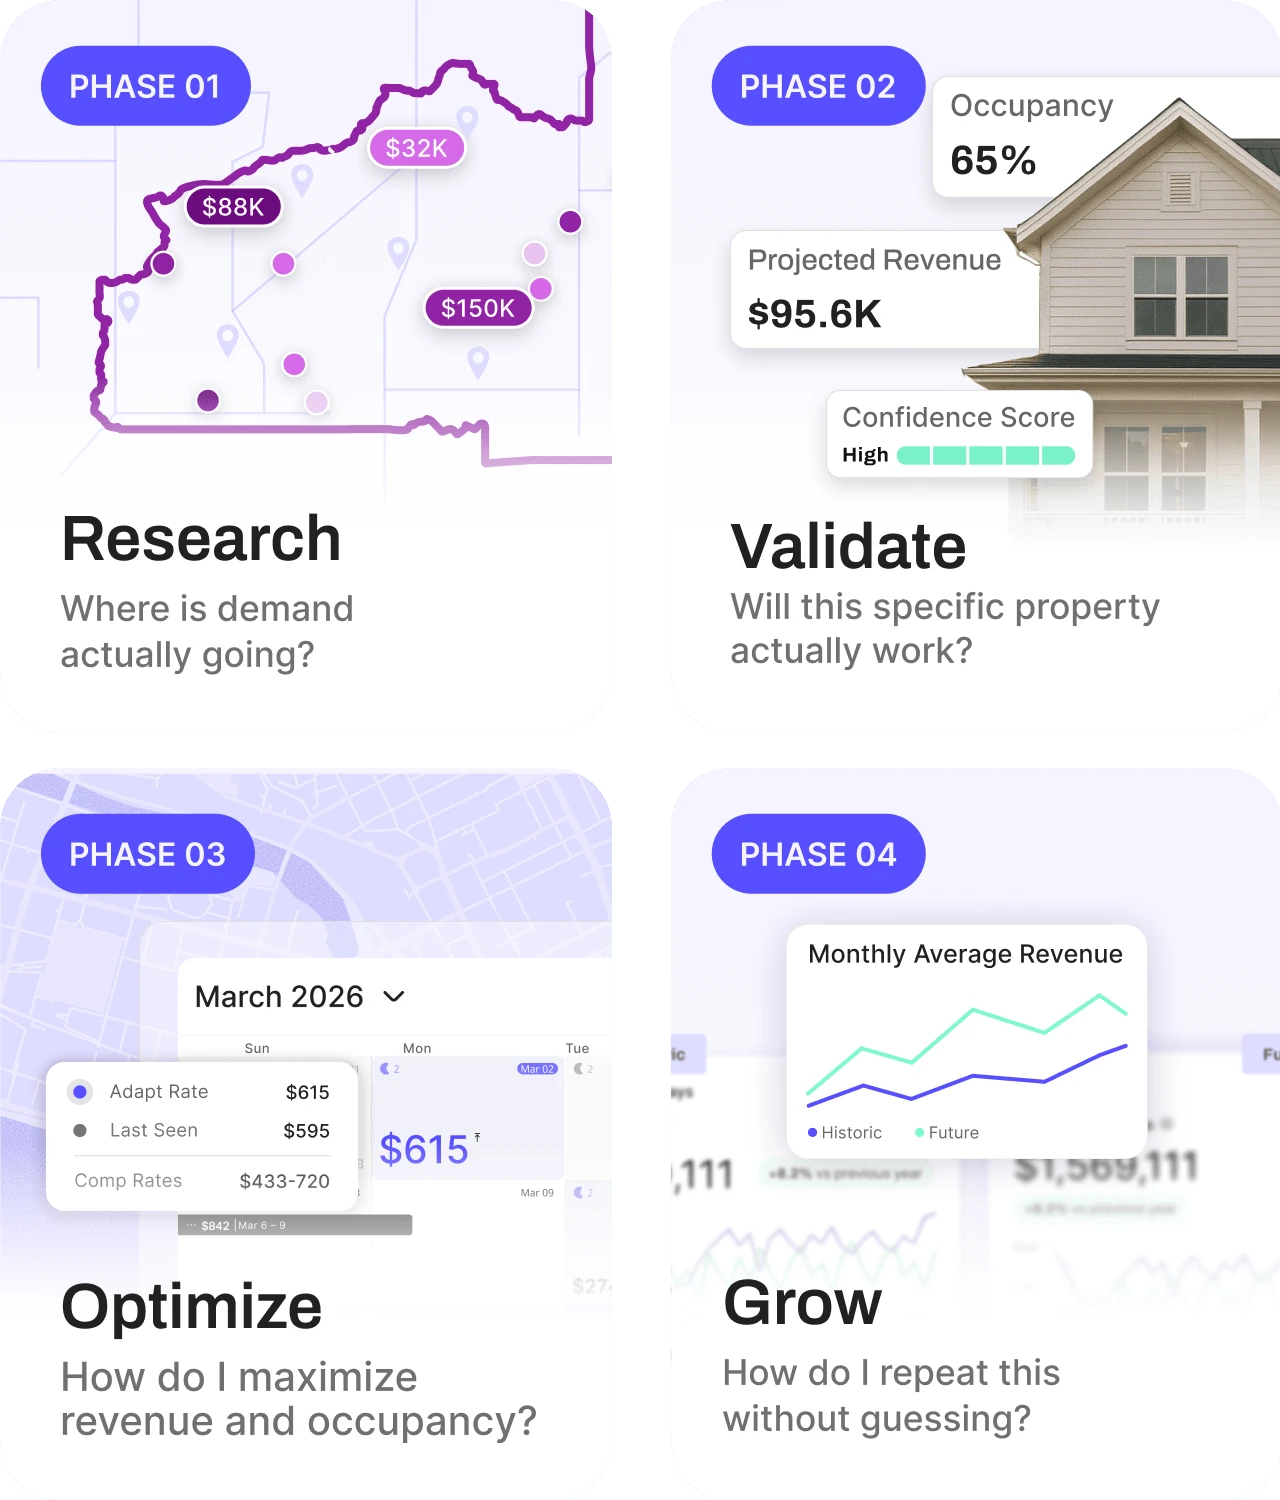
AirDNA is the best-known short-term rental data provider. It shows what similar homes earn night by night, with market scores, revenue estimates for a specific address and comp sets you can adjust. Most lenders, agents and investors in the space recognize its numbers.
Starting price: Free tier with limited data; Research $34/month billed yearly ($400/year) or $125 month to month (AirDNA pricing)
Rating: 4.6/5 from 943 reviews on Trustpilot
See AirDNA pricing, features and FAQs

Airbtics offers occupancy, revenue and rate estimates for markets worldwide, with listing-level history and a calculator for specific addresses. The free plan lets you explore markets with some metrics hidden, and paid plans unlock full calculator reports and comps.
Starting price: Free plan; Insight Pro $39/month, or $109 billed yearly; Analytics Expert $119/month (Airbtics pricing)
Rating: 4.3/5 from 126 reviews on Trustpilot
See Airbtics pricing, features and FAQs
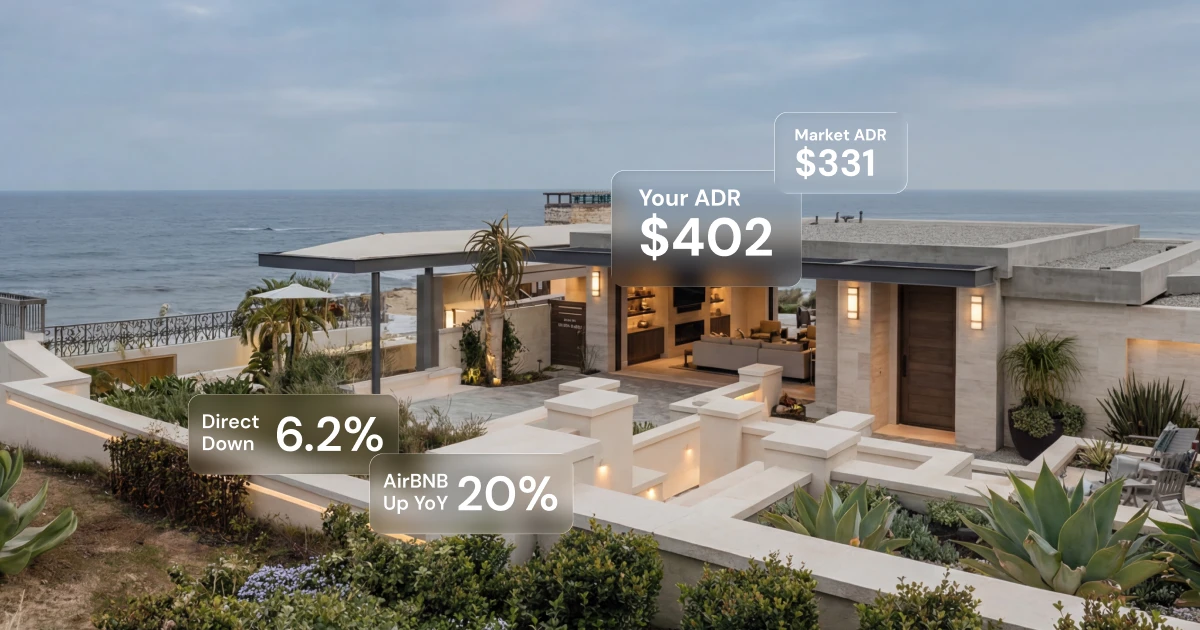
KeyData uses reservation data shared by property managers through their PMS instead of scraping public calendars. That means it sees actual bookings and rates, which makes it popular with professional managers benchmarking their own portfolio against the market.
Starting price: Custom quote
Rating: Not yet rated on our listing
See KeyData pricing, features and FAQs

Mashvisor estimates rental income and returns for US addresses, so you can compare a property as a short-term rental and as a long-term rental before you buy. It is built for investors who want cap rate and cash-on-cash numbers alongside revenue.
Starting price: From $49.99/month (Lite, billed yearly); Standard from $74.99/month
Rating: 4.0/5 from 482 reviews on Trustpilot
See Mashvisor pricing, features and FAQs
Rabbu's free Airbnb calculator gives you a nightly rate, occupancy and seasonal revenue projection for an address, with nearby comps you can include or exclude. It is a good first filter before you pay for deeper data. Rabbu's main paid product is now smart home automation for rentals.
Starting price: Free
Rating: Not yet rated on our listing

Rankbreeze tracks where your Airbnb listing ranks in search each day, so you can test what moves you up: photos, titles, pricing or minimum stays. Some plans include market reports as well.
Starting price: From $29/month for up to 3 listings (about $9.67 per listing), dropping to about $4 per listing at 40+ listings; 14-day trial for $1
Rating: Not yet rated on our listing
See Rankbreeze pricing, features and FAQs
| Your goal | Start with |
|---|---|
| Compare cities or neighborhoods | AirDNA or Airbtics |
| Check a specific address fast and free | Rabbu calculator or the AirDNA free tier |
| Run cap rate and cash-on-cash on a US deal | Mashvisor |
| Benchmark a managed portfolio on real bookings | KeyData |
| Grow bookings on a listing you already own | Rankbreeze plus a dynamic pricing tool |
Most tools estimate revenue by tracking public Airbnb and Vrbo calendars and listing prices, then modeling which blocked nights were real bookings. That works well at the market level but can miss owner stays, discounts and direct bookings. Tools built on reservation data shared by property managers, such as KeyData, see actual bookings but cover fewer listings.
Use scraped data to compare markets quickly, then check the final numbers on a specific property against real comps before you buy.

| Metric | What it means | How to use it |
|---|---|---|
| Average daily rate (ADR) | The average nightly price guests actually paid | Compare against homes with the same bedrooms and amenities |
| Occupancy | The share of available nights that were booked | Compare to similar homes, not the whole market |
| RevPAR | Revenue per available night (ADR times occupancy) | The best single number for comparing listings |
| Revenue percentiles | The 50th percentile is a typical listing; the 75th and 90th are strong operators | Underwrite to the middle, hope for the top |
| Seasonality | Monthly revenue across the year | Your slowest three months decide whether you cover the mortgage |
| Supply growth | How fast new listings are being added | Fast growth can push rates and occupancy down |
For more on these, see our guide to STR benchmarking metrics.
AirDNA is widely used and usually directionally right at the market level. For a single property, treat its estimate as a starting point and check it against real comps nearby, because calendar-based data can count blocked nights as bookings and miss discounts.
Yes. Rabbu's Airbnb calculator is free, Airbtics has a free plan with some metrics hidden, and AirDNA itself has a free tier with limited data. For full reports on a budget, Airbtics Pro is $109 billed yearly.
Use AirDNA or Airbtics to compare markets, Mashvisor to run the return math on a specific US address, and Rabbu's calculator for a quick free check. Then confirm with local comps and the city's short-term rental rules.
Use a market data tool to compare your occupancy and nightly rate against similar homes, and Rankbreeze to see where your listing shows up in Airbnb search. If your rates are the issue, a dynamic pricing tool is usually the faster fix.
It depends on the tool. Most refresh market data at least monthly, and some, like Rabbu's calculator, update weekly. Check the update schedule before relying on recent events like a new regulation or a big local festival.
Prices change often, so confirm the current plan on each vendor's site. Browse more tools in our marketing and data rankings or the full software directory.
